Let’s go through the basic functionality of the MetaTrader 4 platform, as it is the best platform for new traders. To download MetaTrader 4 you can go to our website www.puremarketbroker.com and download it from there, you can choose between our Demo or Real account. Once you have opened an account and downloaded the platform, login with the details provided through email.
Once you have logged in you should see the balance in the bottom right corner to go green, to show that you are connected to the live price feed. Now you have MetaTrader 4 platform installed and opened, the next thing we will go over is how to change the chart options.
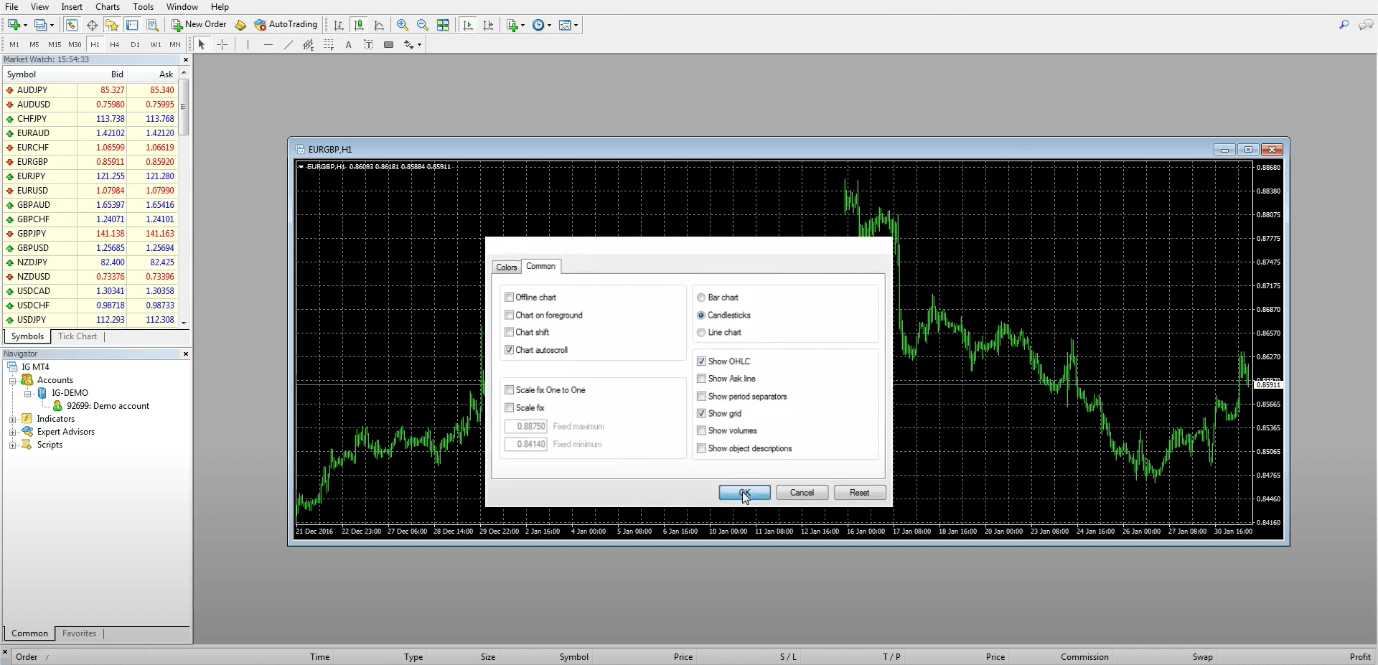
The first thing you need to change is the chart type to a candlestick chart. You can do this by either clicking the chart and then clicking the candlestick button, or you can right click on the chart, go to properties, then click the common tab and select candlesticks and press OK.
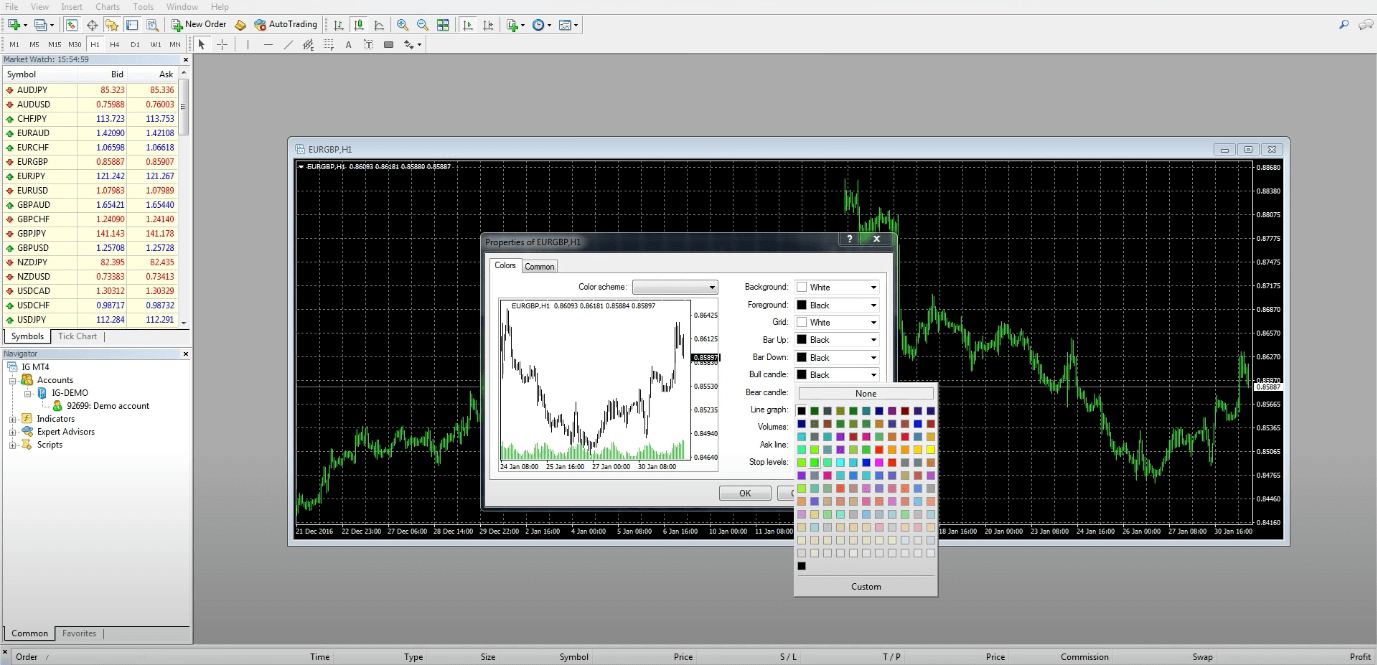
The next thing you could change is the color scheme of the chart. Again to do this, right click on the chart and got to properties and go to the colors tab. Here you will be presented with a list of items and their corresponding colors. You can simply choose the color you want from the drop down menu. Let’s say we want a white background, black foreground, no grid, red and green candles with a black outline. You can play around with these settings as much as you need to get the charts just how you want them.
How to read the current market price in MetaTrader 4?
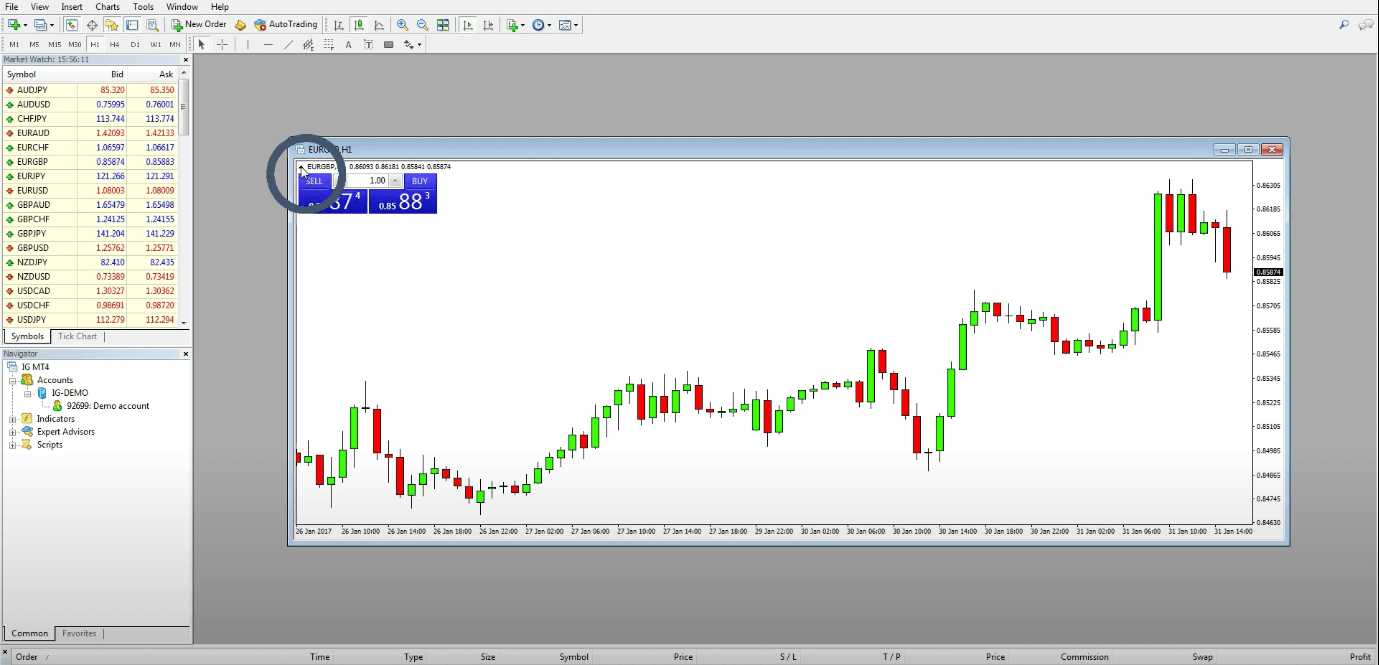
There are a few ways to read what price the market is currently trading at. The first is to just look at the price axis on the chart and the current trading price will be highlighted. Alternatively you can use the Market Watch window as this shows the bid and the ask prices for all the markets on the list. If the window isn’t showing you can simply click the market watch button and this will appear. Lastly you can show the one click trading buttons and you will be able to see the bid and ask price on each chart. To do this, simply click the small black arrow in the top left corner of each chart. If you want to hide them again, simple press the arrow again.
What are templates in MetaTrader 4? How do I use them?
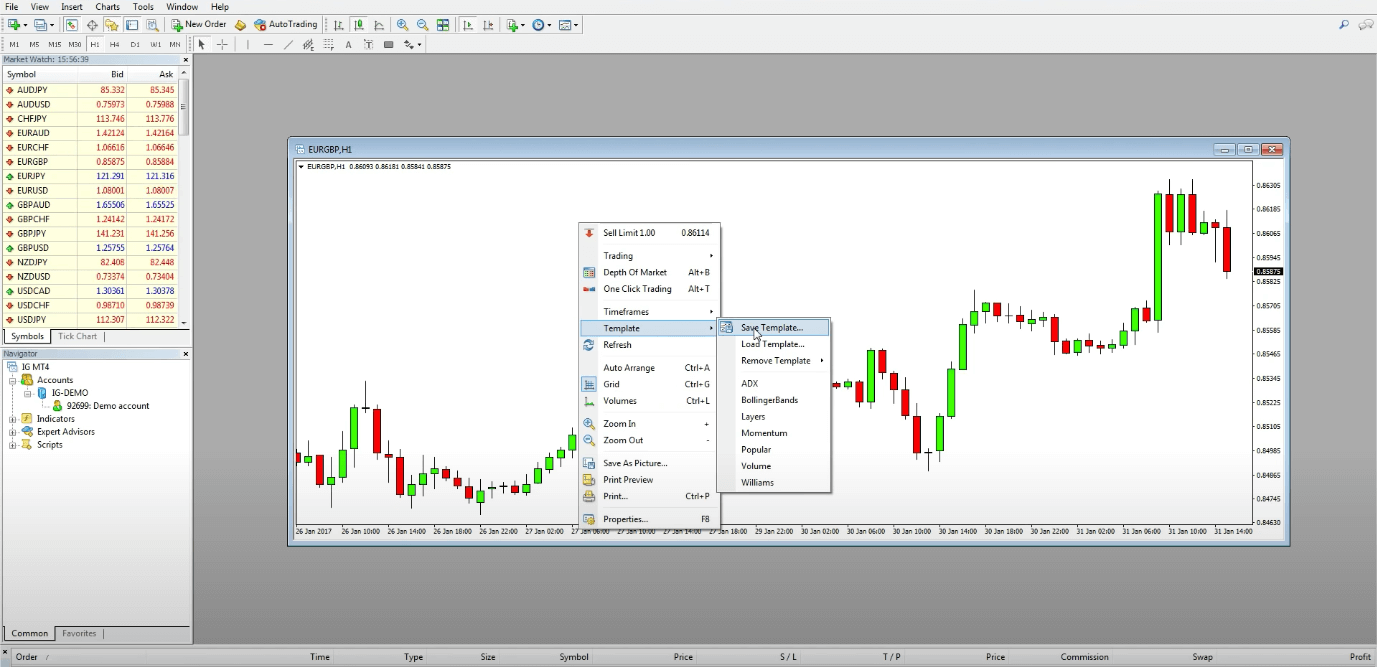
MT4 gives you the ability to make chart templates to save the settings you have made for your charts. For example, you will see if we open a new chart, the settings revert back to before we made the changes. So to save the chart settings you want, you need to make a template. To do this, click on the chart where you have made the setting amendments and then right click on the chart and go to template and press save template. You can call this anything you like, in the example let’s name it “day trading”.
Then when we open a new chart, we can simple right click on it, go to template, then click “Day Trading” and it will use the settings we have saved. You can also go to the template menu by using the button on the quick bar at the top of the platform.
How to view a different market in MetaTrader 4?
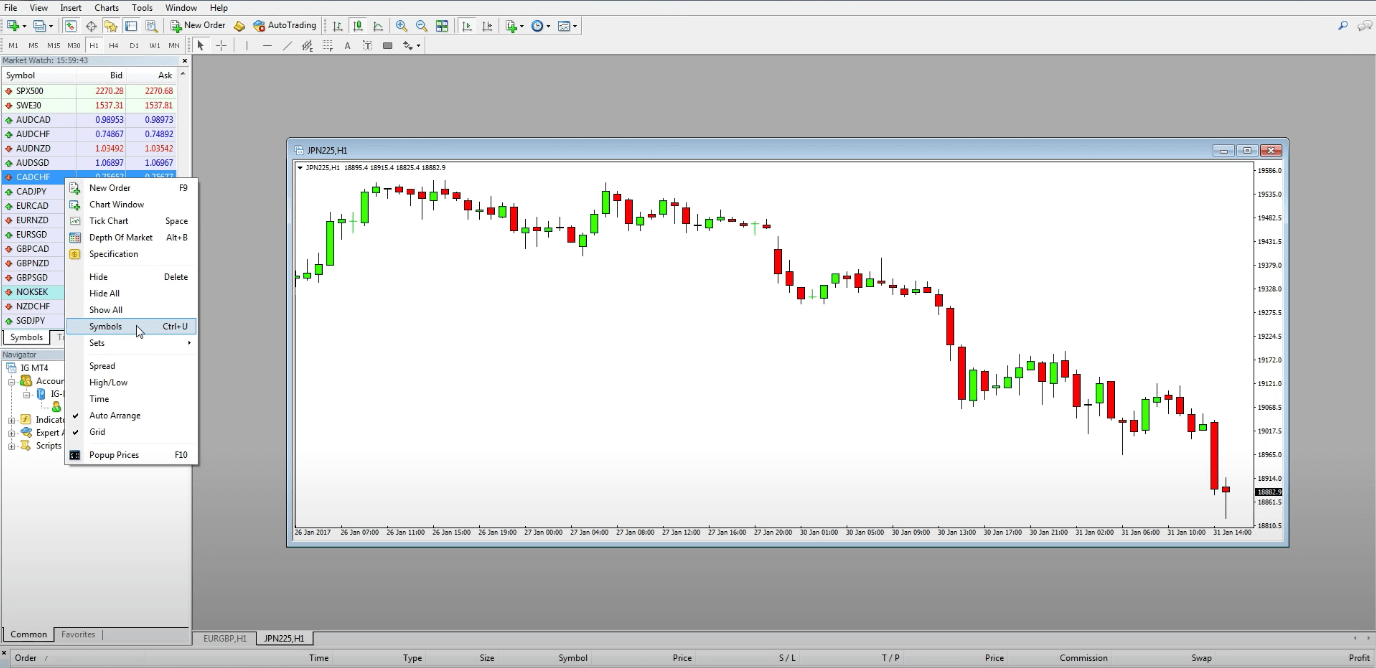
To open a chart of a different market we need the Market Watch window. Again if this isn’t already open, you can open it by clicking the market watch button on the quick bar at the top of the platform. This window shows a long list of all the markets we can look at. Simply right click on the market you want to look at and press chart window and a chart will open up. If the market you are looking for isn’t on the list, you may need to add it. For example, let’s say we want to add the FTSE US 500 Index to our list. So to do this, we need to right click in the Market Watch window and press symbols. You can then look through the different market categories and show or hide any market you like. In this example we are going to add the FTSE US 500 Index so the first step is to go into Indices, click FTSE US 500 Index, press show and then close. Now the FTSE US 500 Index will be in our Market Watch window.
How to change the chart time frame in MetaTrader 4? How to zoom in & out on the chart in MetaTrader 4?
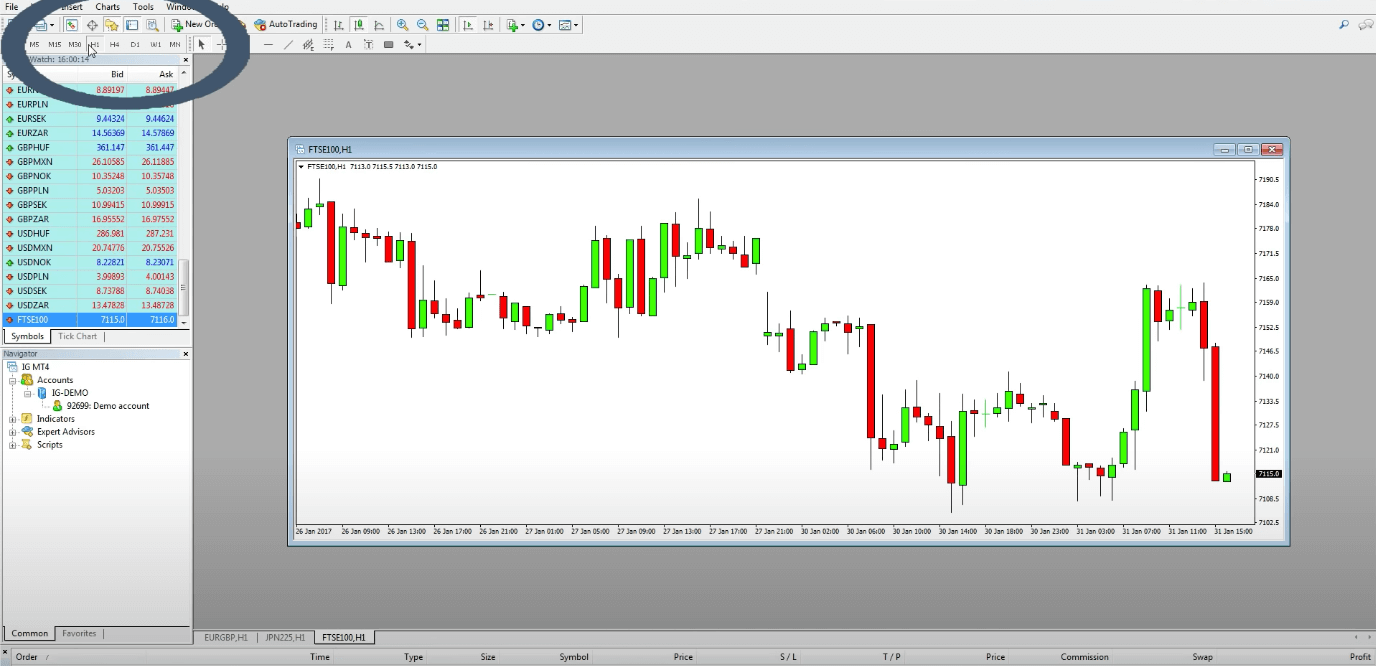
To change the time frame of the chart we can either right click on it and go to time frames, then select the time frame we want to view. Or we can use the time frame quick bar at the top of the platform to quickly choose a different time frame. All you do is click the chart you want to change and then click the time frame button you want. You can also zoom in and out on a chart. Again this can be done by either right clicking on the chart and then pressing either zoom in or zoom out. Or you can use the zoom quick bar buttons at the top of the platform.
How to scroll back on the chart in MetaTrader 4?
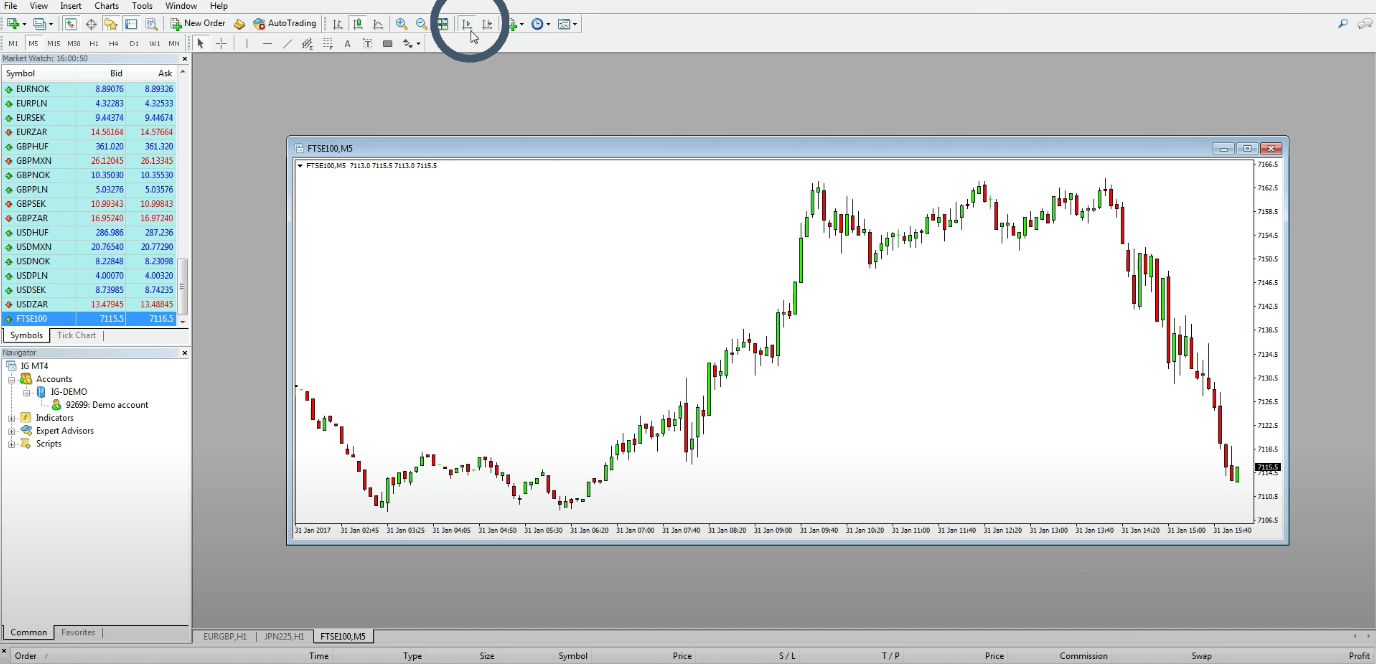
To scroll back on a chart you simply left click on the chart, hold and drag it across to move backwards. You may notice that the chart keeps jumping back to the present time and this happens every time the current price changes. To turn this feature off so you can scroll back without been interrupted by price changes, simply press the button with two axis and a little green play button. If you want to turn this feature back on, simply press the button again.
Elon Musk strikes deal to buy Twitter for $44bn
Netflix’s stocks plunges by 35% wiping more than $50 billion off market cap
Netflix’s stocks plunges by 35% wiping more than $50 billion off market cap
Microsoft Buys Activision for $69 Billion with Eyes on Metaverse Development
Microsoft Buys Activision for $69 Billion with Eyes on Metaverse Development


